
 Slovak
 Hungarian
 Polish
 German
 Spanish
Flowcharts, mind maps, charts, and timelines
Simply create charts, flowcharts, or mind maps. You can then use the created charts in another module.

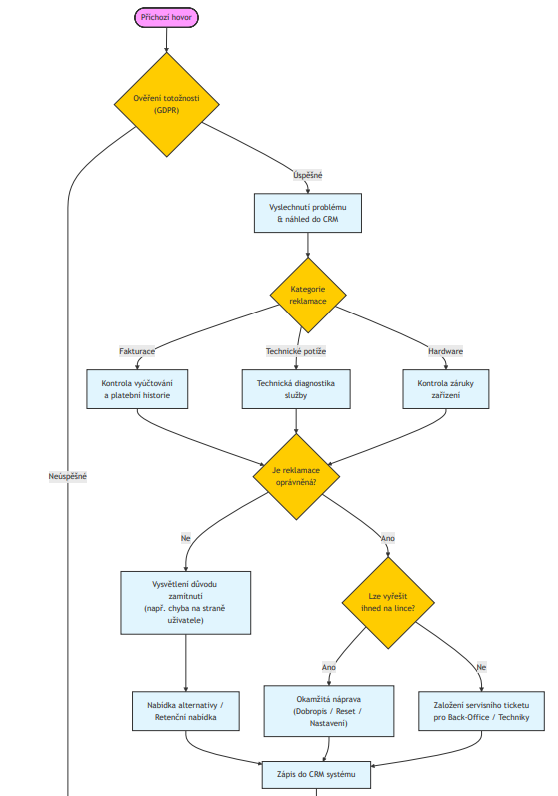
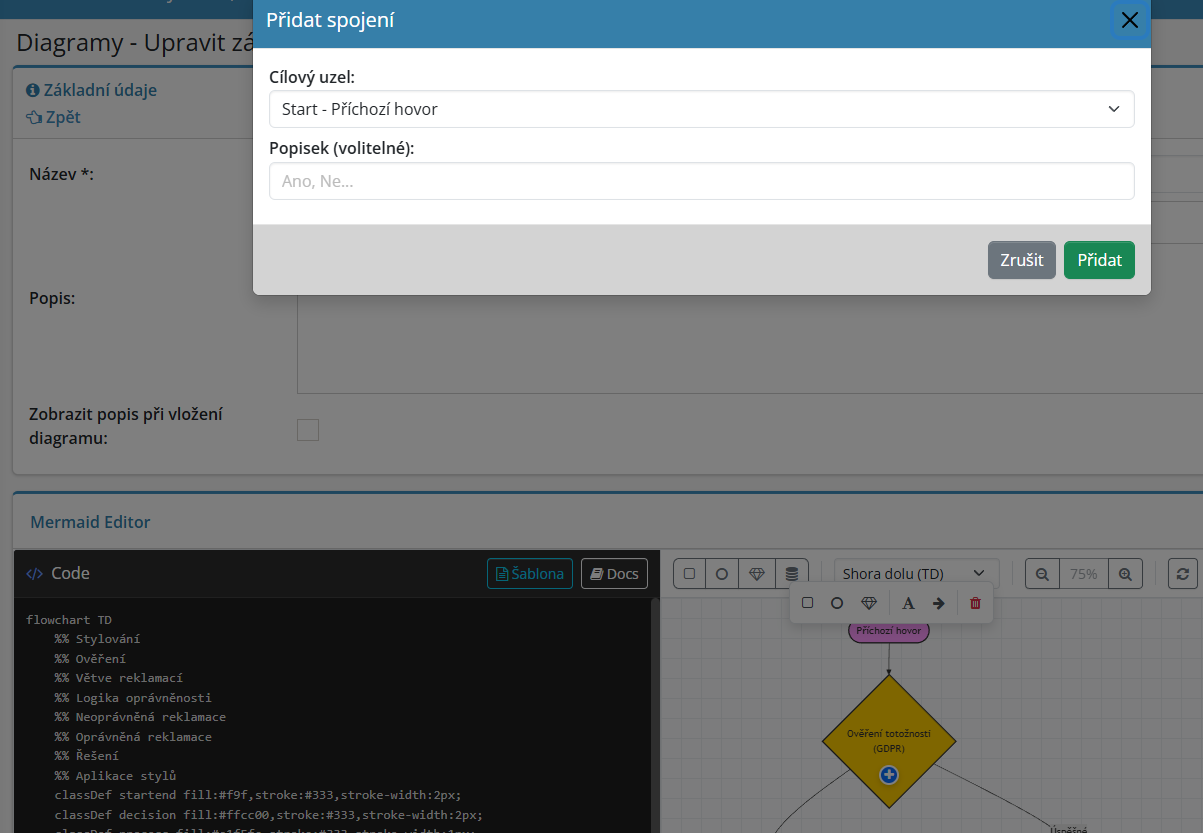
Draw flowcharts, mind maps and charts directly in eIntranet, with no extra software to install. The editor runs on Mermaid and redraws the preview as you type, so you see exactly how the diagram looks at every step.
You never start from a blank page. Pick a ready-made template by category and adjust it to fit. That saves real time on the diagrams you draw again and again, from process maps to project schedules.
Change the shape, text, colour and position of each node and link them with labelled arrows. Work visually or in text notation, whichever suits the moment.
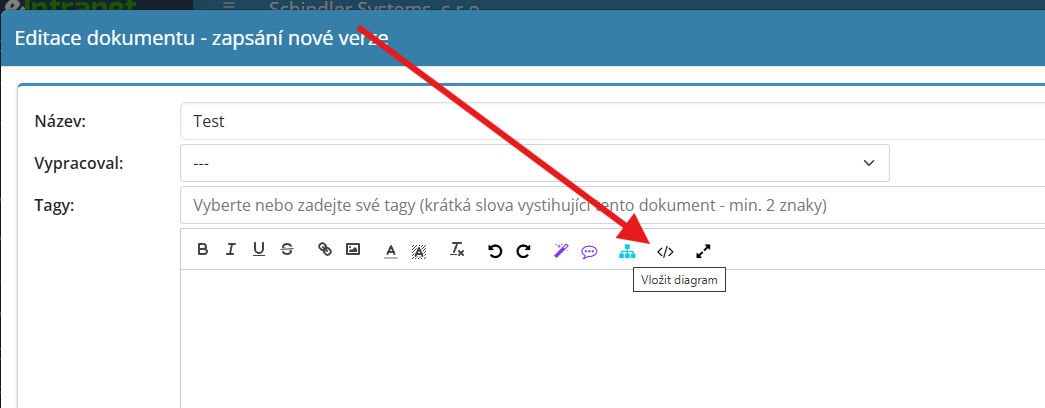
Draw a diagram once and reuse it many times. Insert it into a task, the wiki, a board or a document, and colleagues see it right where they work.
What the diagrams module is good for
-
Ten diagram types in one place
Flowchart, sequence and class diagram, state and ER diagram, Gantt chart, pie chart, mind map, timeline and Git graph.
-
A preview that moves with you
Every change shows up in the preview straight away. No need to generate or export anything to see the result.
-
Full-screen mode
Sketch out complex schemes across your whole monitor and return with the ESC key.
-
Zoom and print
Zoom the preview from 25 to 200 percent and send the finished diagram straight to the printer.
-
Sharing by access rights
For each diagram you decide which users or positions may view and edit it. Your records stay under control.
-
Your own company templates
Save a frequently used scheme as a template for the whole team and simply call it up next time.
-
Recovery of deleted diagrams
A diagram deleted by mistake is not lost, the administrator finds it in the bin and restores it.
Works hand in hand with other modules
Diagrams do not stay locked in one module. Place a finished chart wherever it fits and use it to round out a piece of text or an assignment.
Help/Wiki for this module can be found at: https://wiki.eintranet.net/en/modul/104/diagrams


Ideas, processes and plans on a single canvas
The diagrams module ties charts, flowcharts and mind maps together with the rest of your company system. Create them quickly from a template and share them where colleagues actually work with them.